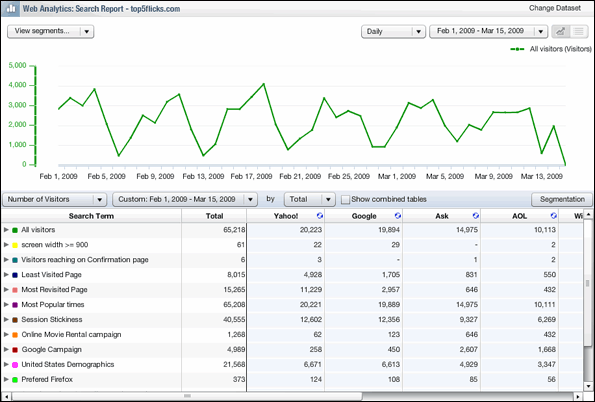
The Data Dissection Report allows you to drill down on visitor behavior to get deeper insight into more than a dozen key metrics.

To view the Data Dissection Report
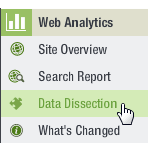
1. In the side navigation bar, click Web Analytics.
2. Click Search Report.

The Data Dissection Report has two major sections: the Key Performance Indicator (KPI) Graph, and the Metrics Table.
To change your dataset
1. Click the Change Dataset button located in the upper right of the screen.

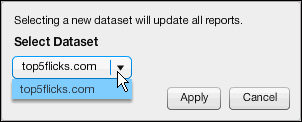
2. In the dialog that appears, click the drop-down list under Select Dataset, and then make your selection.

3. When you are finished, click the Apply button.
The Key Performance Indicators (KPI) Graph